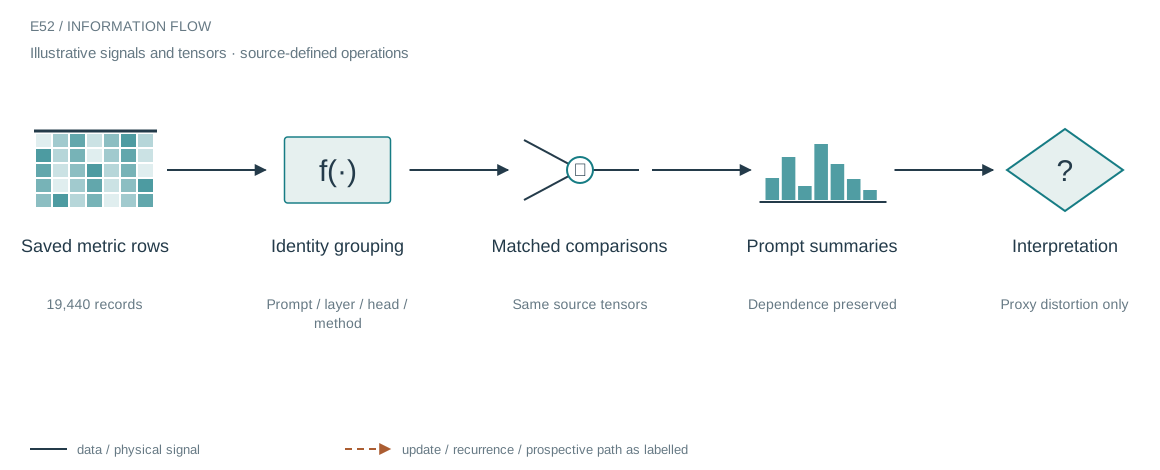
The architecture in context
What this comparison asks
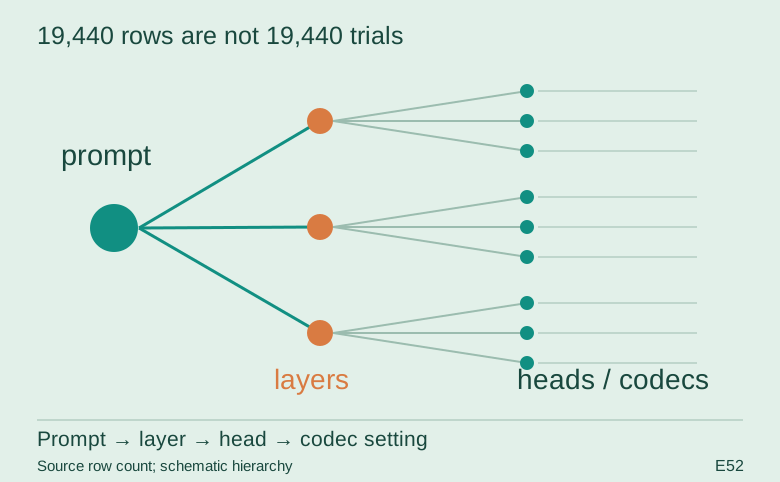
The selected CSV contains 19,440 rows spanning methods, heads, layers and prompts. These rows are useful for locating where a representation fails, but they are not independent language-model trials. A fair comparison first pairs methods on the same source tensor and then preserves the prompt-level grouping when summarizing variation.
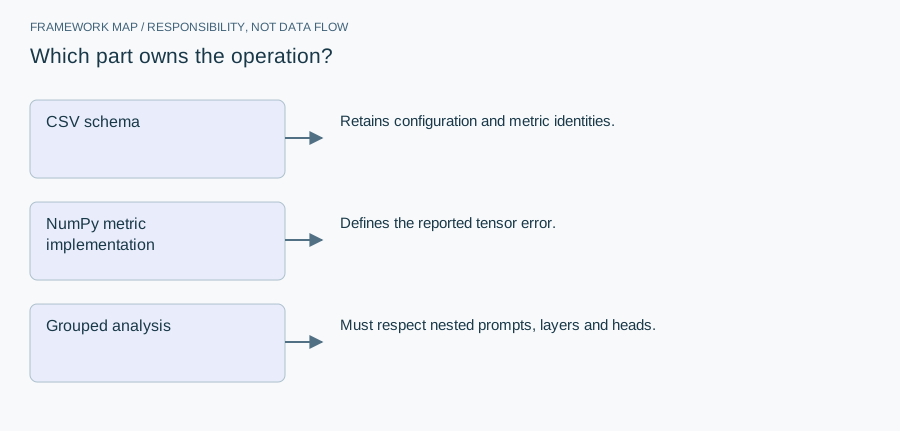
Who does what in the stack
- CSV schema
- Retains configuration and metric identities.
- NumPy metric implementation
- Defines the reported tensor error.
- Grouped analysis
- Must respect nested prompts, layers and heads.
The saved schema records token count, rank, poles, window size, reconstruction error, attention error, cosine and byte estimates. That makes it possible to inspect accounting alongside distortion rather than reporting whichever column looks most favorable. The companion snippet defines the relative reconstruction metric.
Open up the implementation
Rows, prompts and tokens are different sample counts
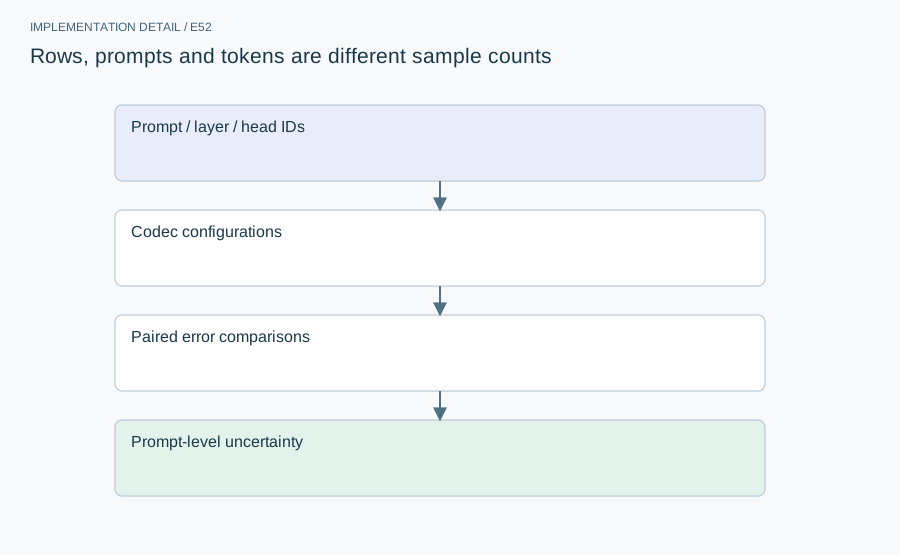
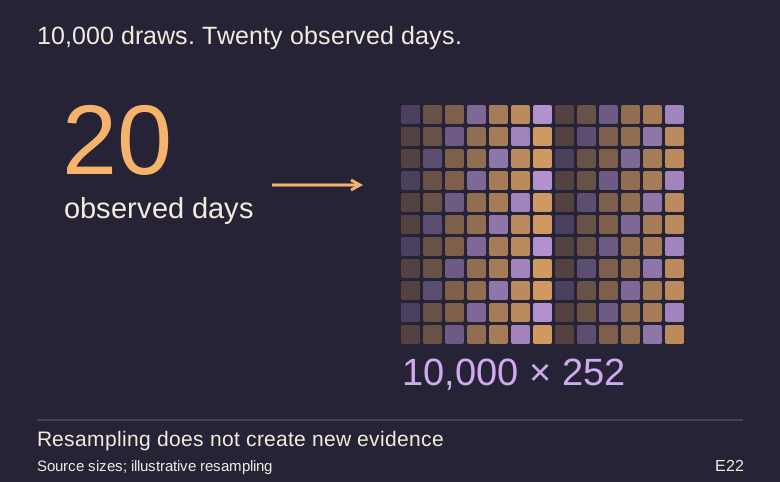
Multiple rows may share the same activation tensor and differ only in method or budget. Others share a prompt but use different layers or heads. Treating all rows as independent would make uncertainty look artificially small. Pair methods on identical inputs before aggregating.
The mathematical contract
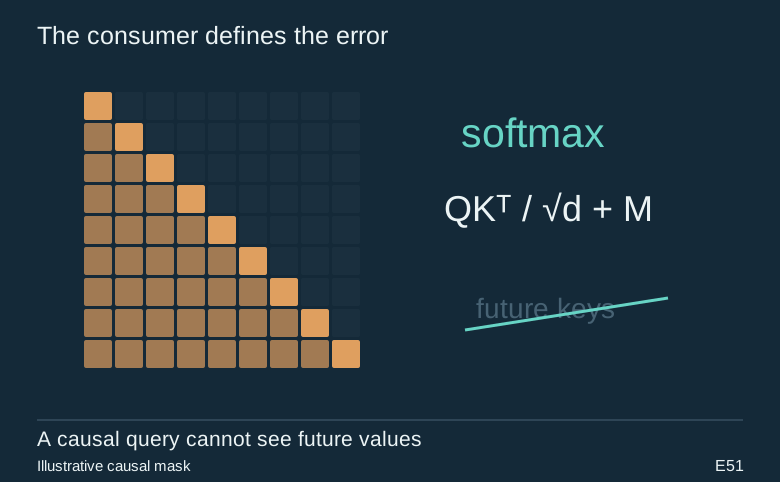
A global average can hide a small number of severely damaged heads or short prompts where metadata dominates. Report distributions and coverage rather than selecting only favorable cases. Estimated compression ratio and attention-proxy fidelity do not establish generation quality or decode throughput.
Implementation and resource card
- Capacity / budget
- 19,440 result rows, not 19,440 independent prompts. Sequence lengths vary despite the 256-token filename.
- Execution evidence
- This revision inspects and explains the archived implementation. It does not rerun the original workload. No unrecorded convergence time, throughput or accelerator result is supplied.
- Current reproduction context
- Current workstation, supplied by the author: Apple M4, 128 GB unified RAM, 40 GPU cores and 16 CPU cores. This is context for prospective reproduction, not attribution of every archived run. Python and framework versions are not fully locked for these historical sources; declarations, when available, are identified separately.
From explanation to a reproducible check
Group by the full tensor identity before comparing methods. Confirm that no configuration is missing selectively, retain failed cases and compute uncertainty at a defensible independent unit such as prompt—not raw CSV row.
Preserve input identities, configuration and failure records with the result. A successful numerical check only establishes the operation it exercises: it does not certify an entire dataset, model or deployed system. Reproduce the interface on a small deterministic input before optimizing throughput or increasing workload size.
A closer look at the implementation
The code that carries the idea
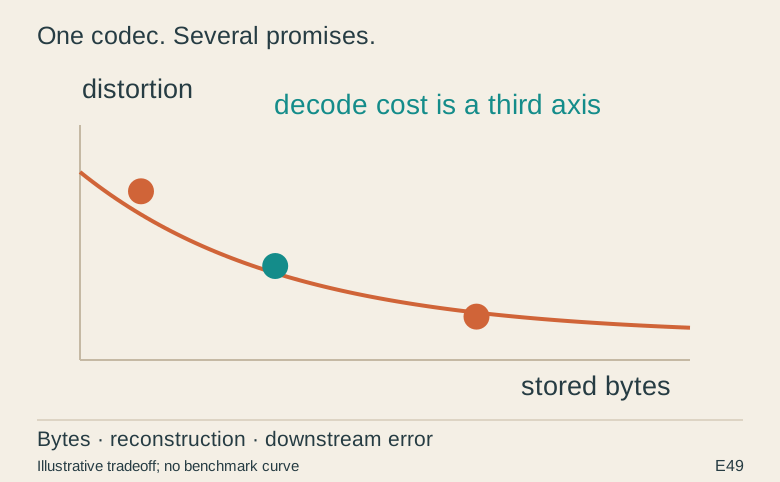
The first recorded prompt/head example illustrates a tradeoff: int8 has relative reconstruction error about 0.012 and an estimated ratio about 1.99; int4 has error about 0.213 and an estimated ratio about 3.97. These are individual rows, not aggregate winners. Actual token counts vary despite the filename’s 256-token limit.
def relative_fro_error(x: np.ndarray, x_hat: np.ndarray) -> float:
    denom = np.linalg.norm(x, ord="fro") + 1e-12
    return float(np.linalg.norm(x - x_hat, ord="fro") / denom)
Verbatim archive excerpt from metrics.py (companion source E51). Context-dependent historical code, not a standalone runnable program. Comments retain their original wording; the article distinguishes implemented behavior from stale or overbroad comments.
The boundary that matters
Estimated bytes inherit the accounting limitations in E50. Attention results inherit the proxy boundaries in E48 and E51. This article does not turn the table into a new significance test or select a favorable subset of heads.